geom_catenary() draws a catenary curve (hanging chain) between
successive points. geom_arch() draws an inverted catenary curve and
is hence intended for people living on the southern hemisphere.
The shape follows the catenary equation: \(\ y = a\ \cosh \ \!\bigl(\frac{x - h}{a}\bigr) + v\).
Usage
geom_catenary(
  mapping = NULL,
  data = NULL,
  stat = "catenary",
  position = "identity",
  ...,
  chain_length = NULL,
  sag = NULL,
  chainLength = lifecycle::deprecated(),
  na.rm = FALSE,
  show.legend = NA,
  inherit.aes = TRUE
)

geom_arch(
  mapping = NULL,
  data = NULL,
  stat = "arch",
  position = "identity",
  ...,
  arch_length = NULL,
  arch_height = NULL,
  arrow = NULL,
  arrow.fill = NULL,
  lineend = "butt",
  linejoin = "round",
  linemitre = 10,
  na.rm = FALSE,
  show.legend = NA,
  inherit.aes = TRUE
)

stat_catenary(
  mapping = NULL,
  data = NULL,
  geom = "catenary",
  position = "identity",
  ...,
  chain_length = NULL,
  sag = NULL,
  na.rm = FALSE,
  show.legend = NA,
  inherit.aes = TRUE
)

stat_arch(
  mapping = NULL,
  data = NULL,
  geom = "arch",
  position = "identity",
  ...,
  arch_length = NULL,
  arch_height = NULL,
  na.rm = FALSE,
  show.legend = NA,
  inherit.aes = TRUE
)
Arguments
- mapping
Set of aesthetic mappings created by
aes(). If specified andinherit.aes = TRUE(the default), it is combined with the default mapping at the top level of the plot. You must supplymappingif there is no plot mapping.- data
The data to be displayed in this layer. There are three options:
If
NULL, the default, the data is inherited from the plot data as specified in the call toggplot().A
data.frame, or other object, will override the plot data. All objects will be fortified to produce a data frame. Seefortify()for which variables will be created.A
functionwill be called with a single argument, the plot data. The return value must be adata.frame, and will be used as the layer data. Afunctioncan be created from aformula(e.g.~ head(.x, 10)).- position
A position adjustment to use on the data for this layer. This can be used in various ways, including to prevent overplotting and improving the display. The
positionargument accepts the following:The result of calling a position function, such as
position_jitter(). This method allows for passing extra arguments to the position.A string naming the position adjustment. To give the position as a string, strip the function name of the
position_prefix. For example, to useposition_jitter(), give the position as"jitter".For more information and other ways to specify the position, see the layer position documentation.
- ...
Other arguments passed on to
layer()'sparamsargument. These arguments broadly fall into one of 4 categories below. Notably, further arguments to thepositionargument, or aesthetics that are required can not be passed through.... Unknown arguments that are not part of the 4 categories below are ignored.Static aesthetics that are not mapped to a scale, but are at a fixed value and apply to the layer as a whole. For example,
colour = "red"orlinewidth = 3. The geom's documentation has an Aesthetics section that lists the available options. The 'required' aesthetics cannot be passed on to theparams. Please note that while passing unmapped aesthetics as vectors is technically possible, the order and required length is not guaranteed to be parallel to the input data.When constructing a layer using a
stat_*()function, the...argument can be used to pass on parameters to thegeompart of the layer. An example of this isstat_density(geom = "area", outline.type = "both"). The geom's documentation lists which parameters it can accept.Inversely, when constructing a layer using a
geom_*()function, the...argument can be used to pass on parameters to thestatpart of the layer. An example of this isgeom_area(stat = "density", adjust = 0.5). The stat's documentation lists which parameters it can accept.The
key_glyphargument oflayer()may also be passed on through.... This can be one of the functions described as key glyphs, to change the display of the layer in the legend.
- chain_length
Numeric vector of physical chain lengths. Recycled to the number of segments. If
NULLandsagis alsoNULL, defaults to twice the Euclidean distance per segment. Can be mixed withsagby placingNAin the appropriate positions.- sag
Numeric vector giving the vertical drop of the curve below the lowest endpoint of each segment. Takes precedence over
chain_lengthwhen both are supplied for the same segment.- chainLength
![[Superseded]](figures/lifecycle-superseded.svg) Use
Use
chain_lengthinstead.- na.rm
If
FALSE, the default, missing values are removed with a warning. IfTRUE, missing values are silently removed.- show.legend
logical. Should this layer be included in the legends?
NA, the default, includes if any aesthetics are mapped.FALSEnever includes, andTRUEalways includes. It can also be a named logical vector to finely select the aesthetics to display. To include legend keys for all levels, even when no data exists, useTRUE. IfNA, all levels are shown in legend, but unobserved levels are omitted.- inherit.aes
If
FALSE, overrides the default aesthetics, rather than combining with them. This is most useful for helper functions that define both data and aesthetics and shouldn't inherit behaviour from the default plot specification, e.g.annotation_borders().- arch_length
Numeric vector of arch lengths. Recycled to the number of segments. If
NULLandarch_heightis alsoNULL, defaults to twice the Euclidean distance per segment. Can be mixed witharch_heightby placingNAin the appropriate positions.- arch_height
Numeric vector giving the vertical rise of the arch above the highest endpoint of each segment. Takes precedence over
arch_lengthwhen both are supplied for the same segment.- arrow
Arrow specification, as created by
grid::arrow().- arrow.fill
fill colour to use for the arrow head (if closed).
NULLmeans usecolouraesthetic.- lineend
Line end style (round, butt, square).
- linejoin
Line join style (round, mitre, bevel).
- linemitre
Line mitre limit (number greater than 1).
- geom, stat
Override the default connection between
geom_catenary()andstat_catenary(), or betweengeom_arch()andstat_arch().
Value
A ggplot2::layer() object that can be added to a ggplot2::ggplot().
See also
The catenary equation is described at https://en.wikipedia.org/wiki/Catenary.
Aesthetics
geom_catenary() understands the following aesthetics. Required aesthetics are displayed in bold and defaults are displayed for optional aesthetics:
| • | x | |
| • | y | |
| • | alpha | → NA |
| • | colour | → via theme() |
| • | group | → inferred |
| • | linetype | → via theme() |
| • | linewidth | → via theme() |
Learn more about setting these aesthetics in vignette("ggplot2-specs").
Examples
library(ggplot2)
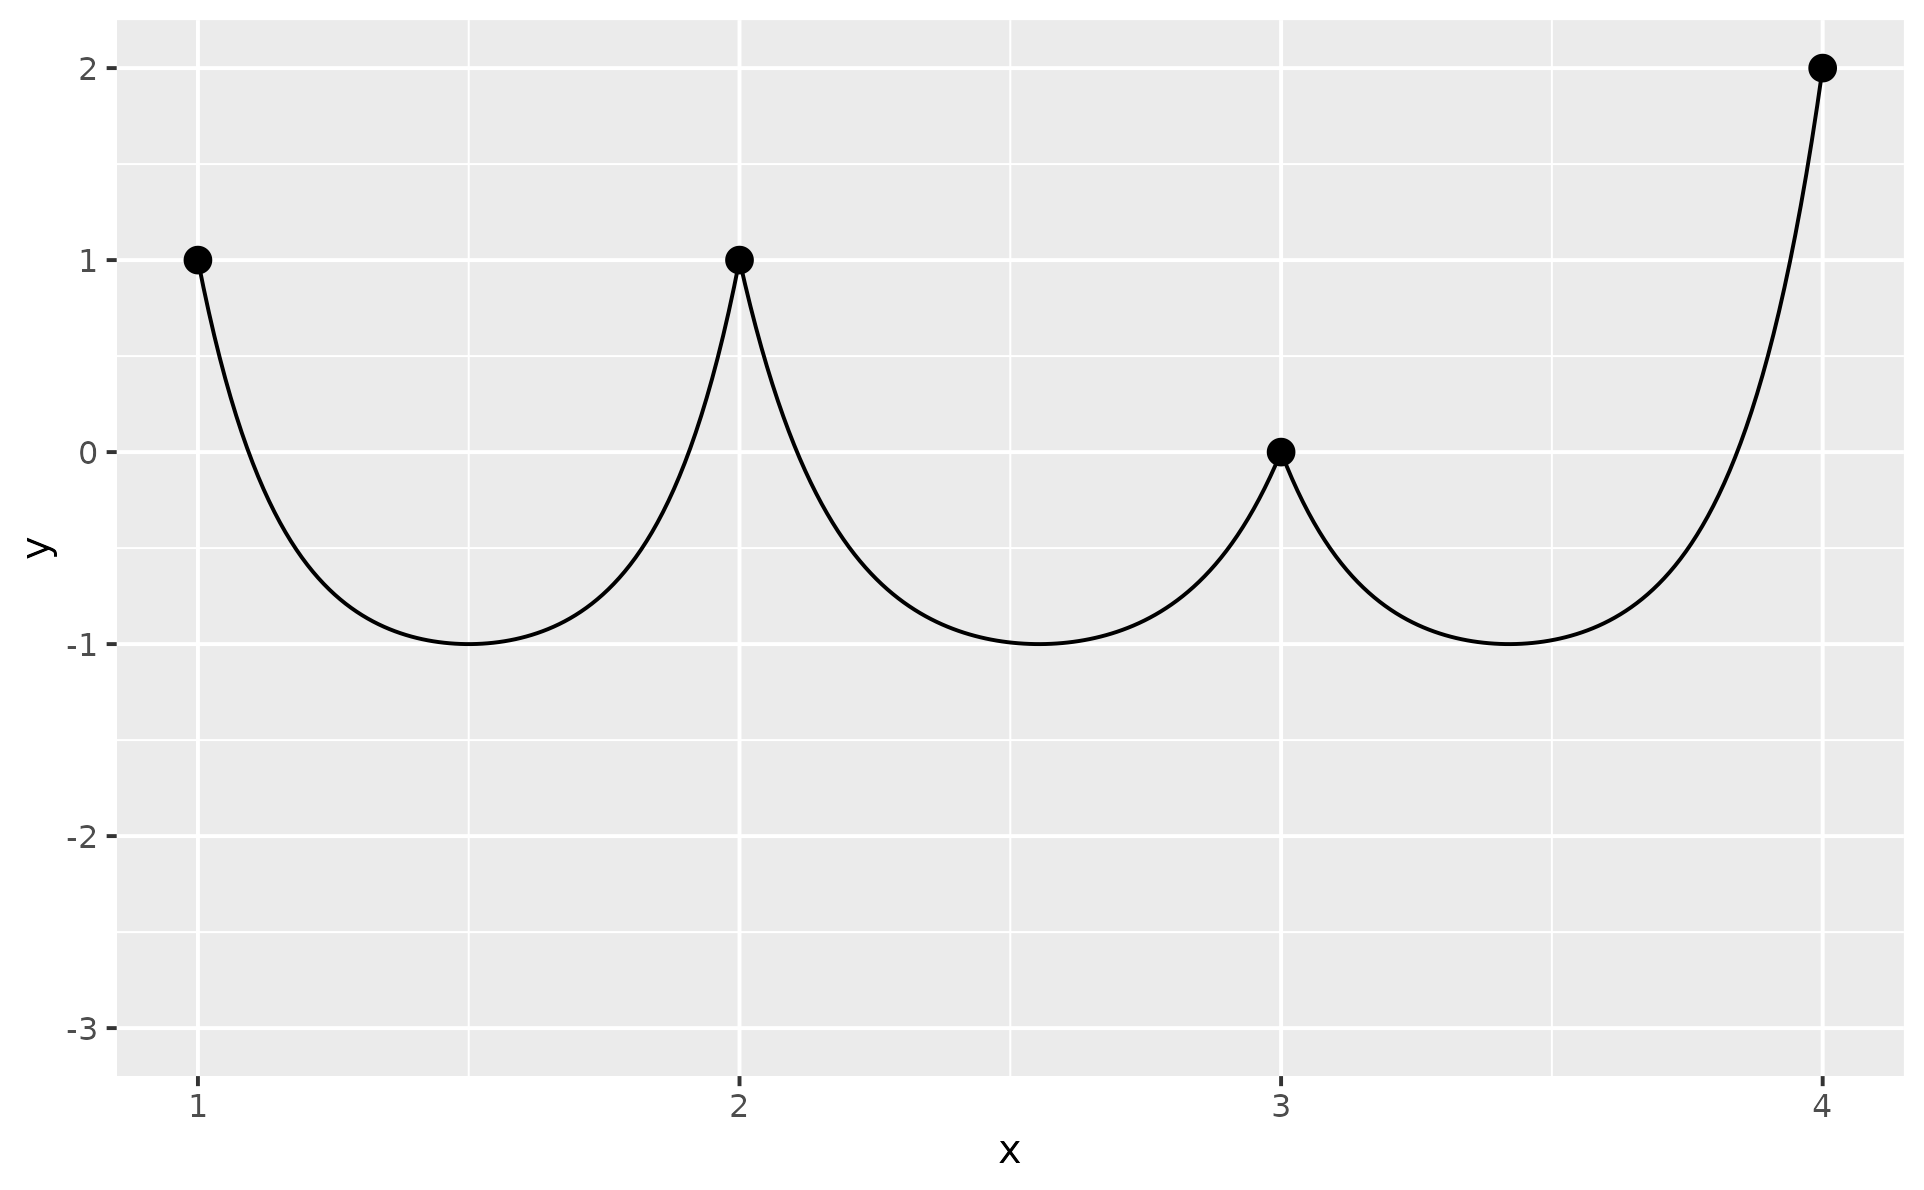
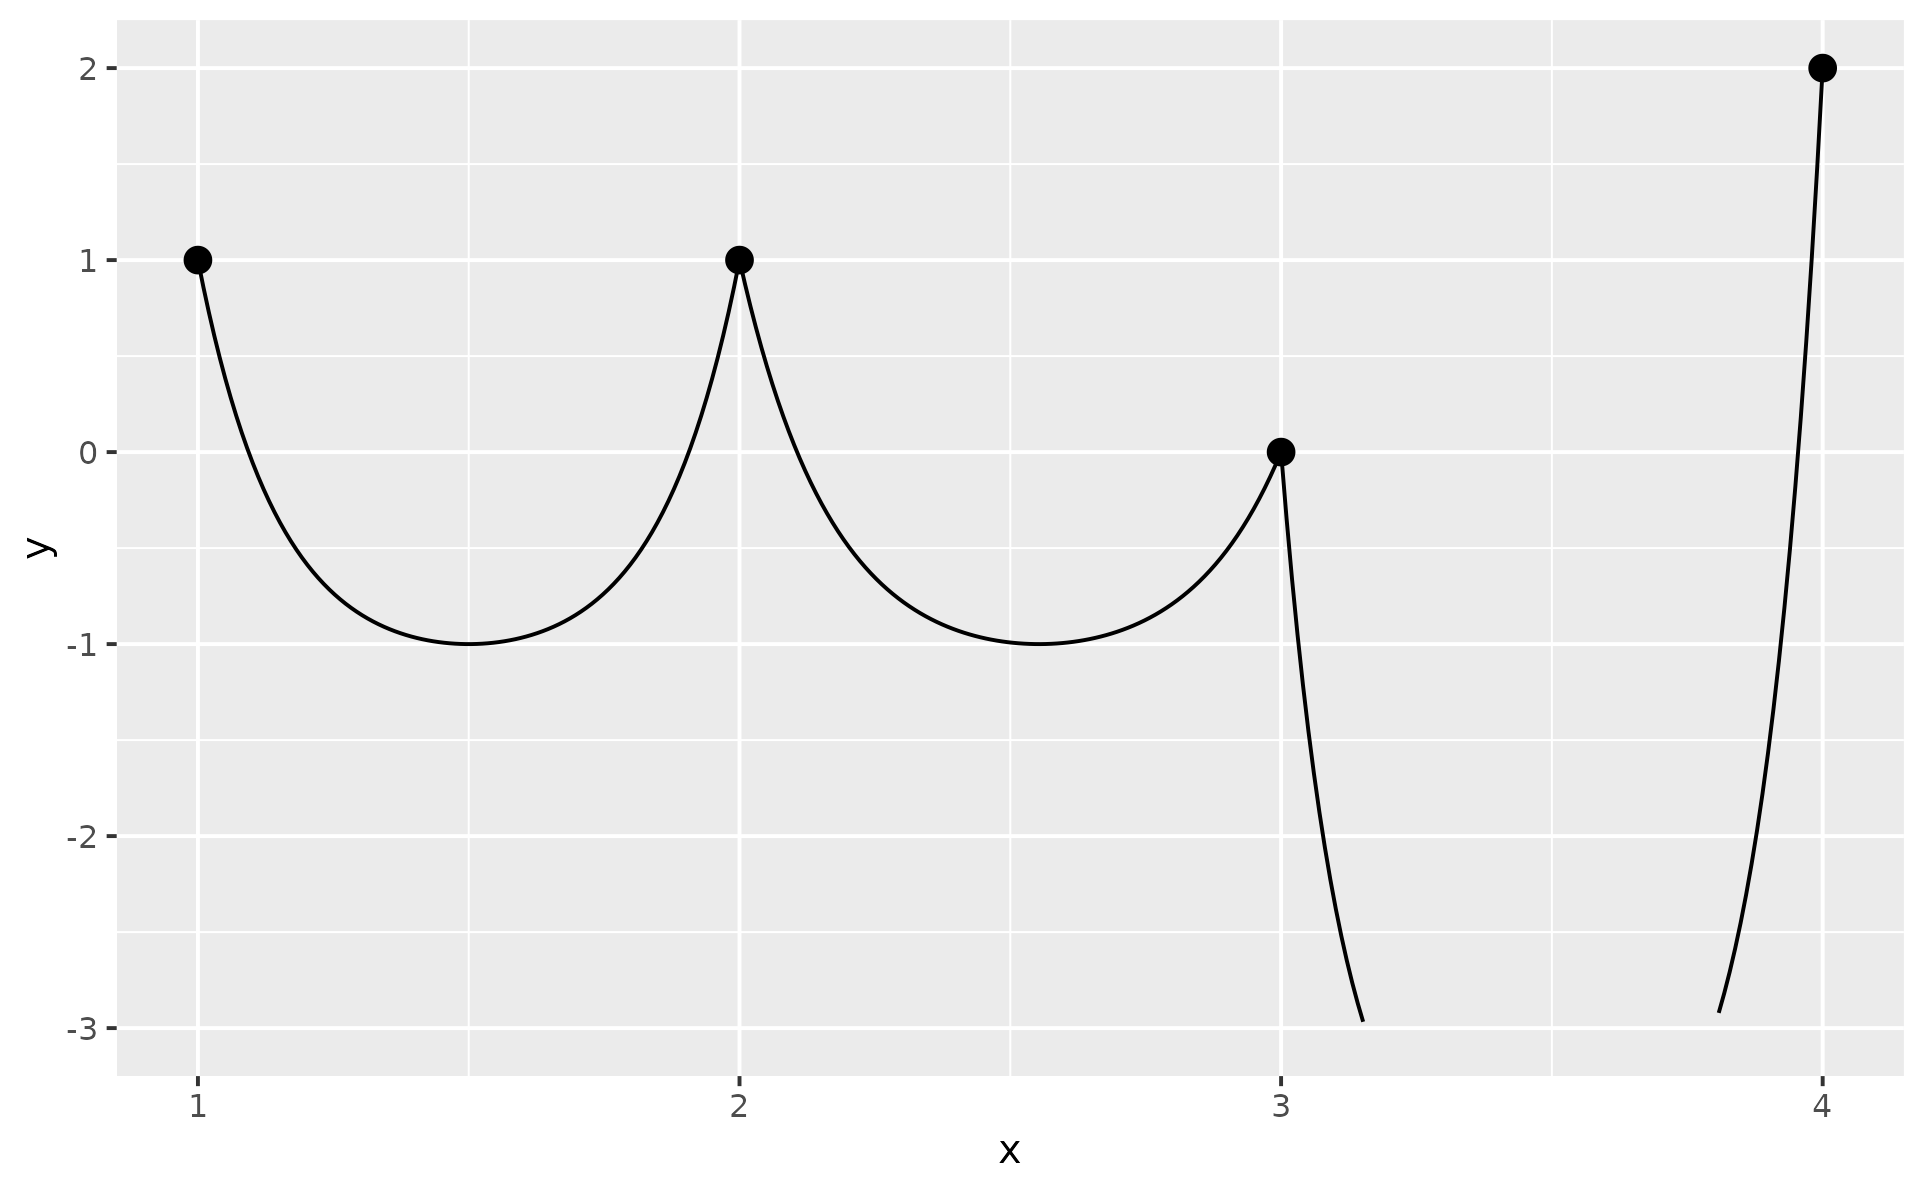
df <- data.frame(x = seq_len(4), y = c(1, 1, 0, 2))
# Basic usage
p <- ggplot(df, aes(x, y)) + ylim(-3, NA) + geom_point(size = 3)
p + geom_catenary()
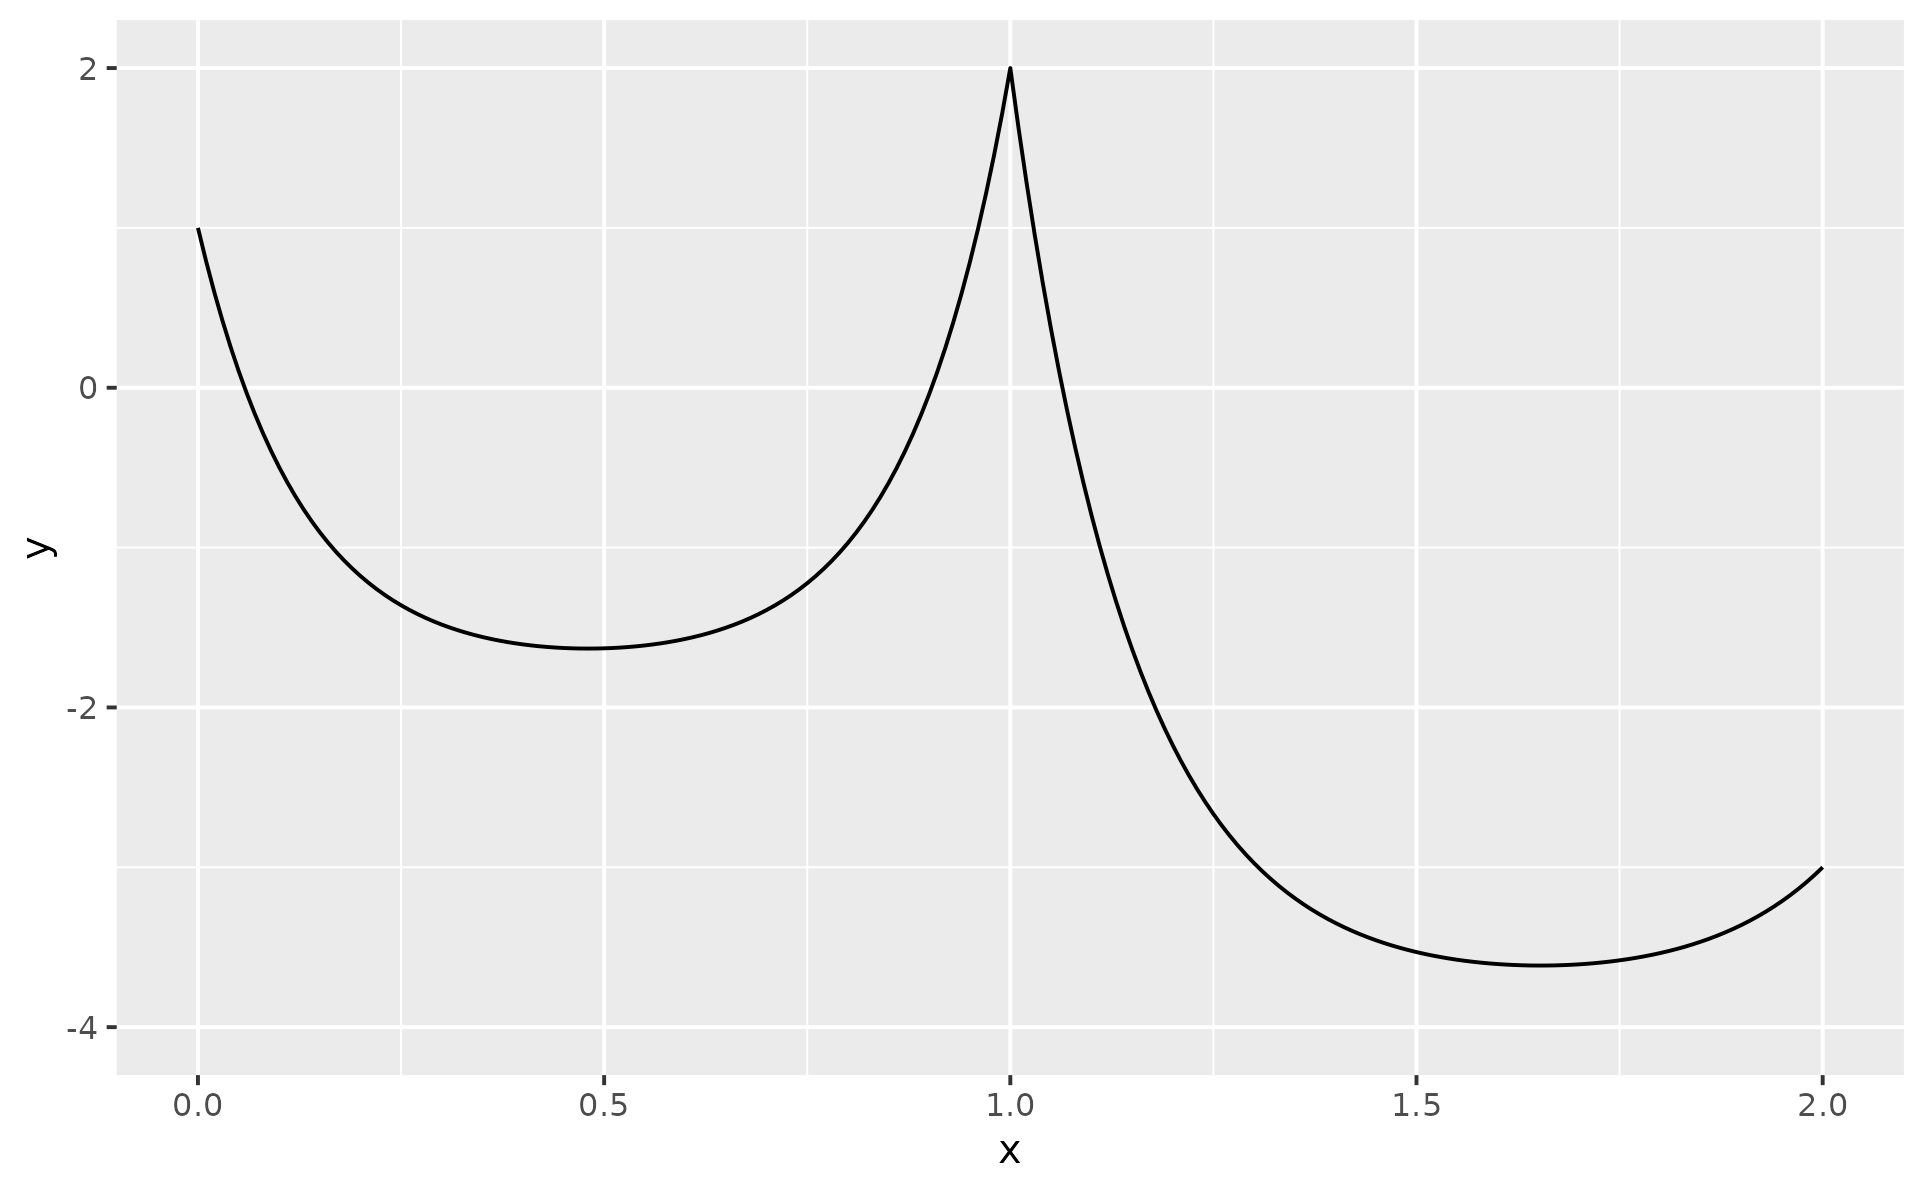 # Catenary with sag = 2, considered from lowest point of each segment
# recycled, if only a one value is provided
p + geom_catenary(sag = 2)
# Catenary with sag = 2, considered from lowest point of each segment
# recycled, if only a one value is provided
p + geom_catenary(sag = 2)
 p + geom_catenary(sag = c(2, 1, 1))
 # If sag and chain_length are provided for same segment(s), sag wins
p + geom_catenary(sag = c(2, 1, NA), chain_length = 10)
#> Both `sag` and `chain_length` supplied for 2 segments; using `sag`.
#> This message is displayed once every 8 hours.
# If sag and chain_length are provided for same segment(s), sag wins
p + geom_catenary(sag = c(2, 1, NA), chain_length = 10)
#> Both `sag` and `chain_length` supplied for 2 segments; using `sag`.
#> This message is displayed once every 8 hours.
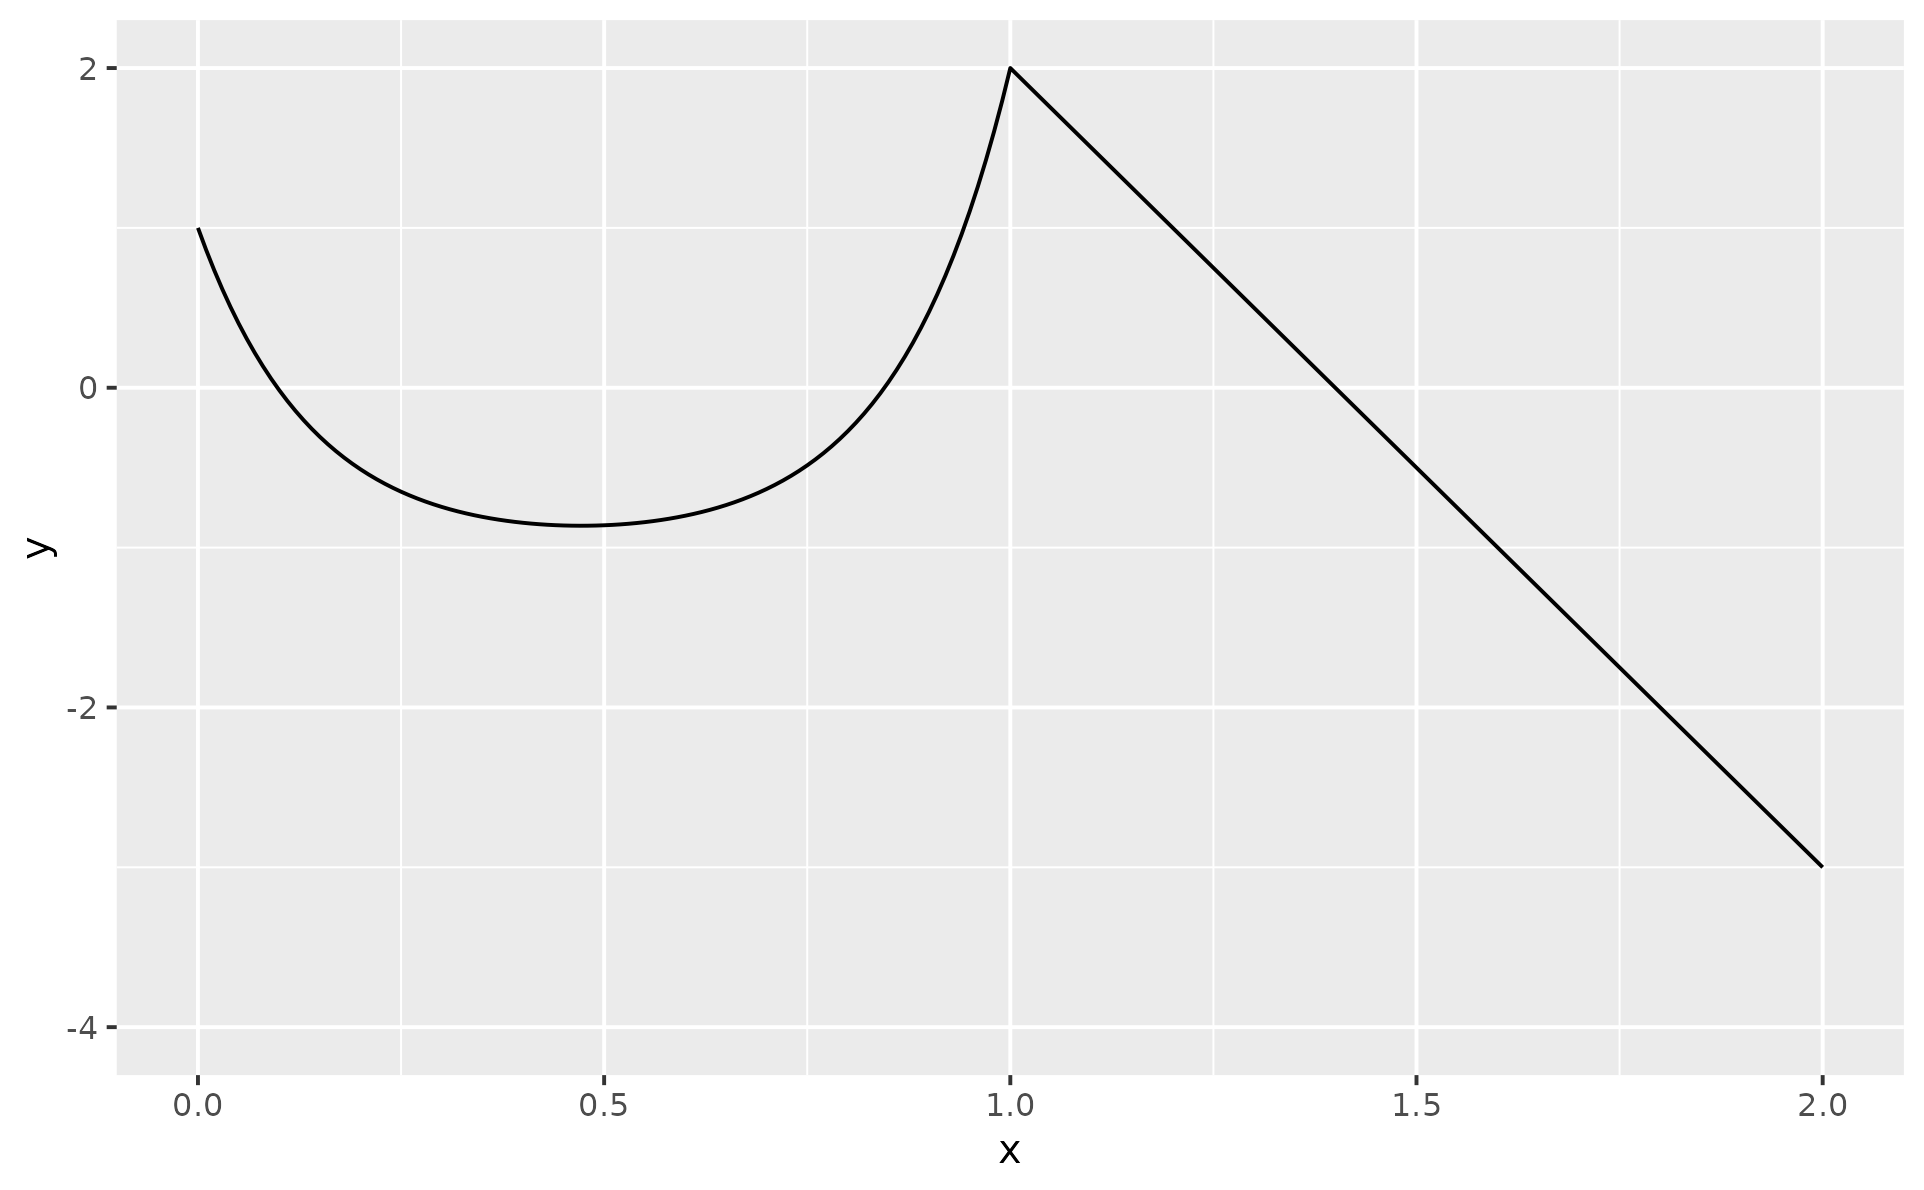
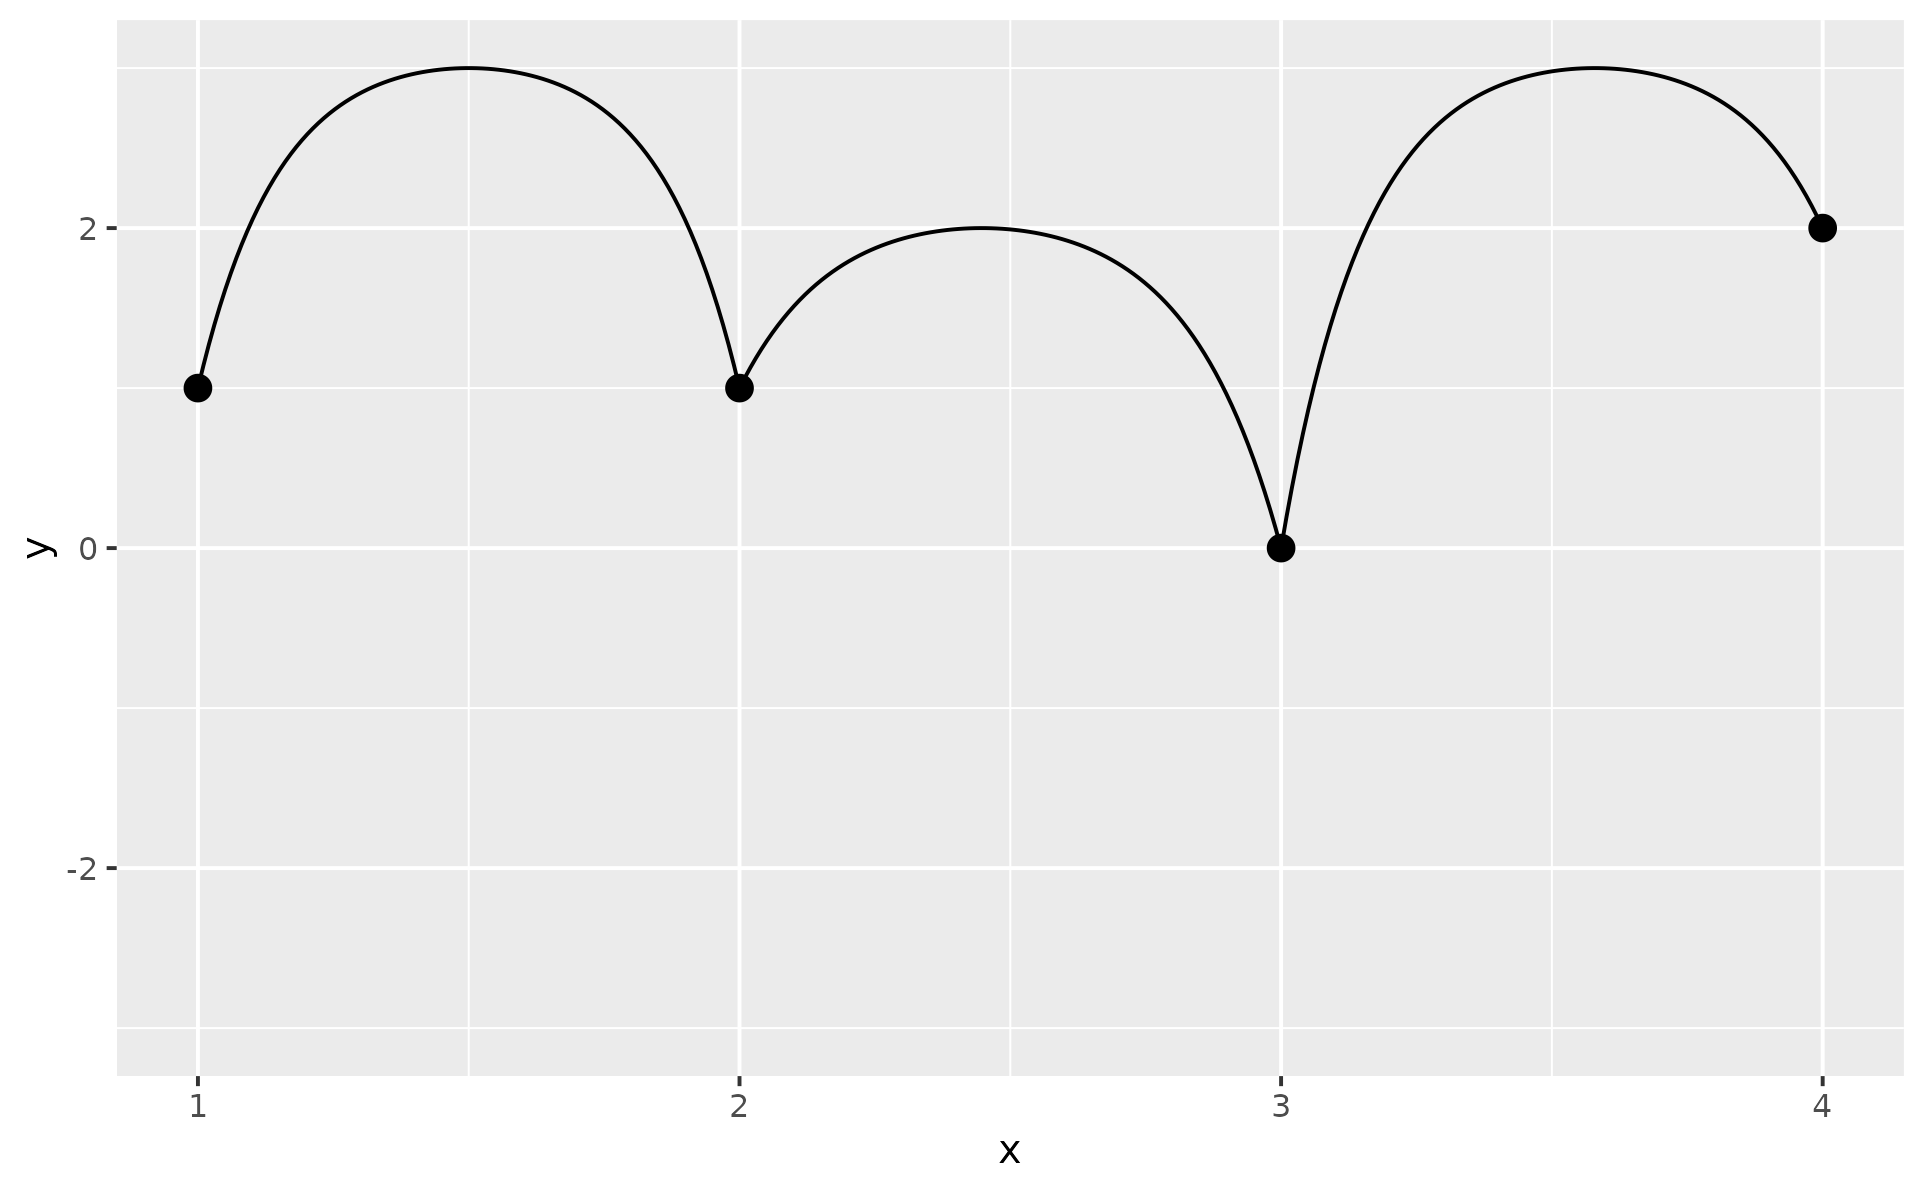
 # Arch with height = 2, considered from highest point of each segment
p + geom_arch(arch_height = c(2, 1, 1))
# Arch with height = 2, considered from highest point of each segment
p + geom_arch(arch_height = c(2, 1, 1))
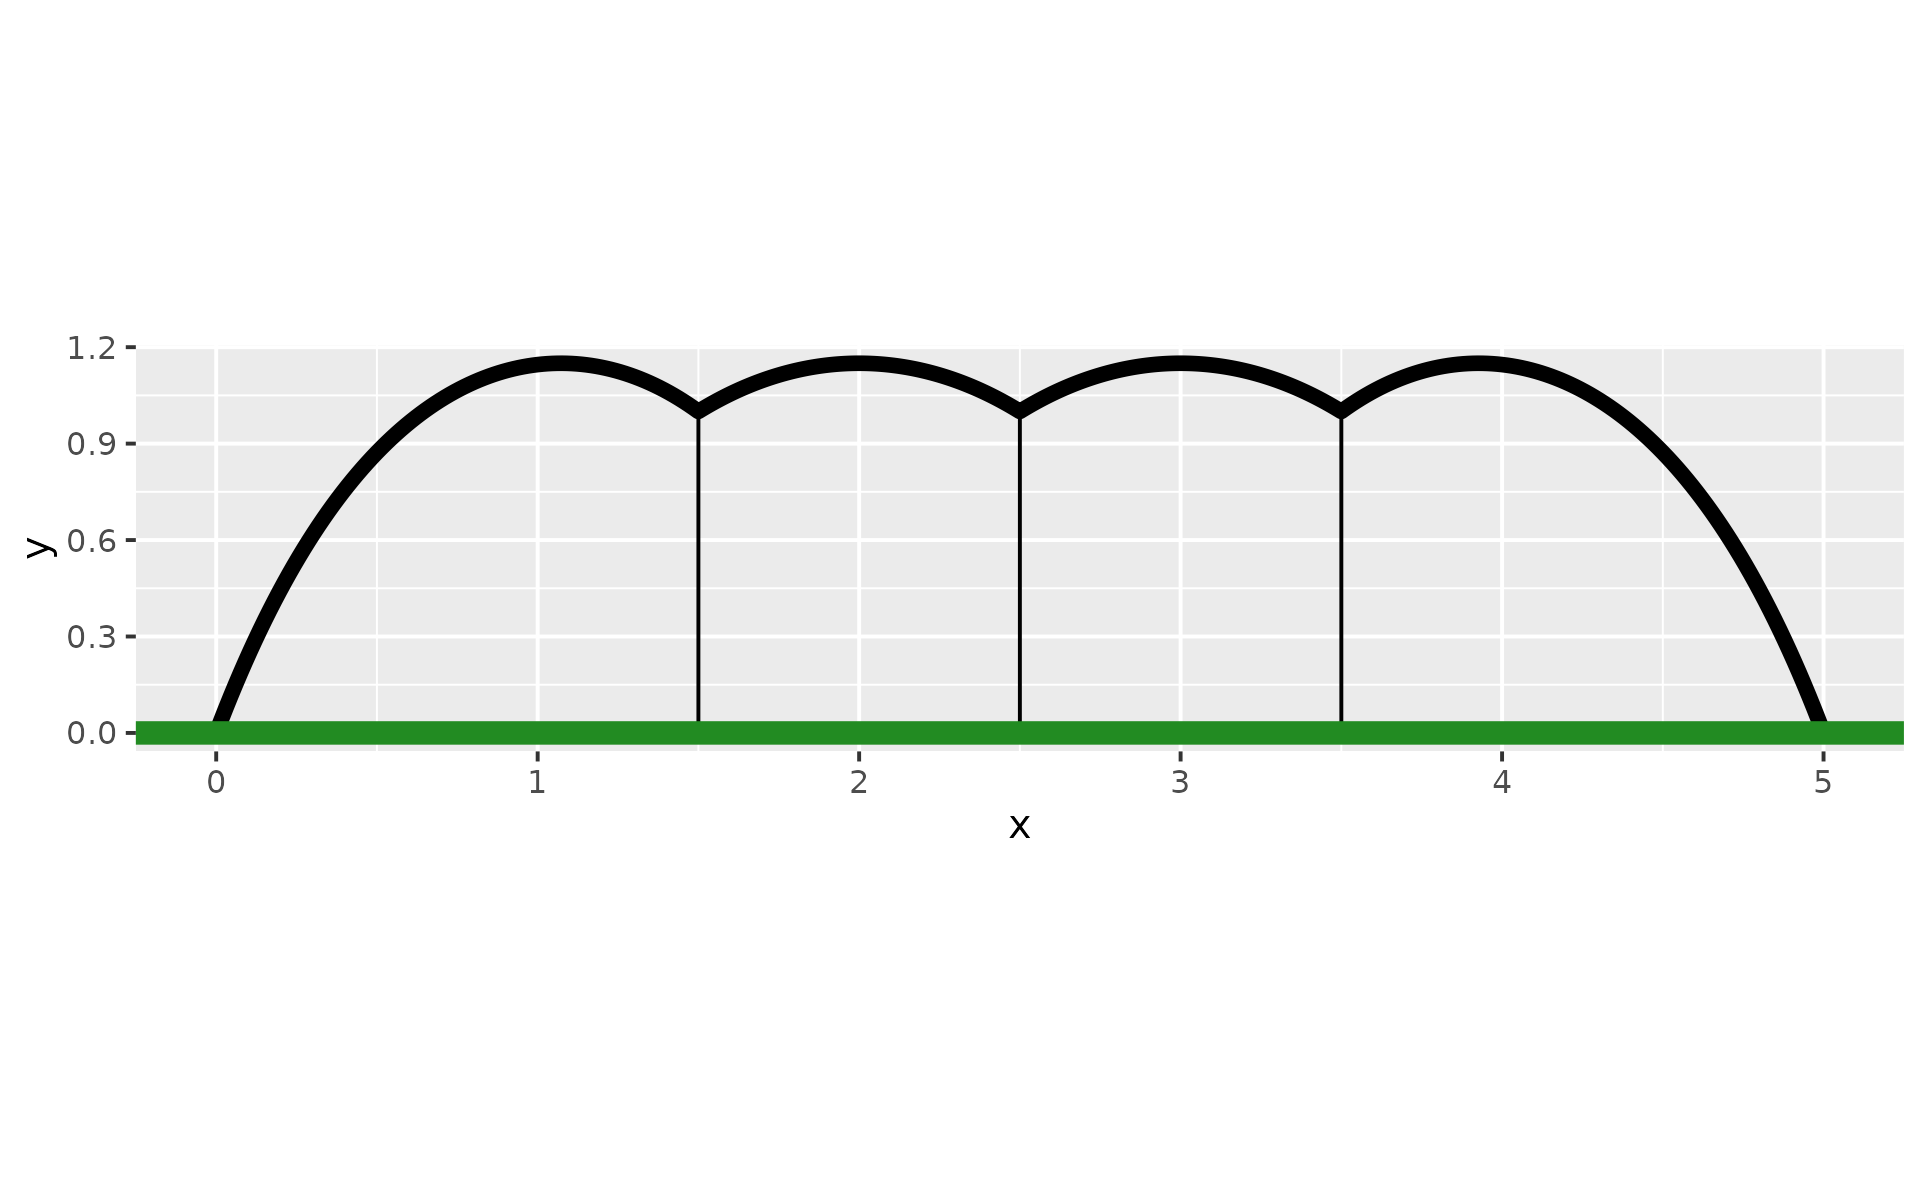
 # Rice house, see https://en.wikipedia.org/wiki/Rice_House,_Eltham
rice_house <- data.frame(x = c(0, 1.5, 2.5, 3.5, 5), y = c(0, 1, 1, 1, 0))
ggplot(rice_house, aes(x, y)) +
geom_arch(arch_height = .15, lwd = 2) +
geom_segment(aes(xend = x, yend = 0)) +
geom_hline(yintercept = 0, colour = "forestgreen", linewidth = 3) +
coord_equal()
# Rice house, see https://en.wikipedia.org/wiki/Rice_House,_Eltham
rice_house <- data.frame(x = c(0, 1.5, 2.5, 3.5, 5), y = c(0, 1, 1, 1, 0))
ggplot(rice_house, aes(x, y)) +
geom_arch(arch_height = .15, lwd = 2) +
geom_segment(aes(xend = x, yend = 0)) +
geom_hline(yintercept = 0, colour = "forestgreen", linewidth = 3) +
coord_equal()